AWS CloudWatch Agent Installation for memory metric & Integrate with Grafana
In this blog, I’ll install AWS CloudWatch agent on AWS EC2 Ubuntu 20.04 instance & collect memory metric in AWS CloudWatch console, after that we’ll integrate AWS CloudWatch custom metrics with 3rd party tool Grafana which will fetch CPU/memory metrics from CloudWatch metrics & show the data on portal.

Step 1- Launch an EC2 with Ubuntu AMI 20.04
I believe that we can launch it own so I’m not explaining the process for it.
Used AMI: (Ubuntu 20.04)

EC2 Instance: (Type: t2.micro)

Step 2: Attach an IAM role with EC2 Instance
Access to AWS resources requires permissions. You create an IAM role, an IAM user, or both to grant permissions that the CloudWatch agent needs to write metrics to CloudWatch. If you’re going to use the agent on Amazon EC2 instances, you must create an IAM role. If you’re going to use the agent on on-premises servers, you must create an IAM user.
Create an IAM role, Make sure that AWS service is selected under Select type of trusted entity. For Choose a use case, choose EC2 under Common use cases, Choose Next: Permissions. In the list of policies, select CloudWatchAgentServerPolicy & create an IAM role.

Now attach an IAM role with EC2 Instance. Go to EC2 — Select Instance — Click on Action — Security — Modify IAM role

Choose create IAM role & save it.

Step 3: Download the CloudWatch Agent Package
Use the following steps to download the CloudWatch agent package, SSH to Instance & Download CW Agent package.
Download the CloudWatch agent:
wget https://s3.amazonaws.com/amazoncloudwatch-agent/ubuntu/amd64/latest/amazon-cloudwatch-agent.deb

Install the package:
dpkg -i -E ./amazon-cloudwatch-agent.deb

Update Packages & Install collectd: (This will take a few minutes if you haven’t updated your available updates prior)
apt-get update && apt-get install collectd


Step 4: Create the CloudWatch Agent Configuration File
Before running the CloudWatch agent on any servers, you must create a CloudWatch agent configuration file. The agent configuration file is a JSON file that specifies the metrics and logs that the agent is to collect, including custom metrics. The agent configuration file wizard, amazon-cloudwatch-agent-config-wizard, asks a series of questions.
/opt/aws/amazon-cloudwatch-agent/bin/amazon-cloudwatch-agent-config-wizard
We’re using Linux machine so option 1

Using EC2 Instance so Option 1

Select an user

We can skip this two option for memory metric.

We can choose below options according to our requirements.
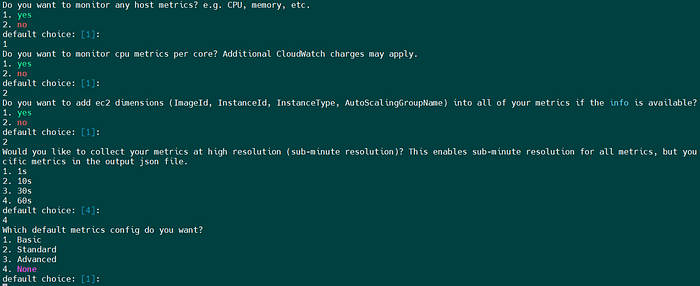
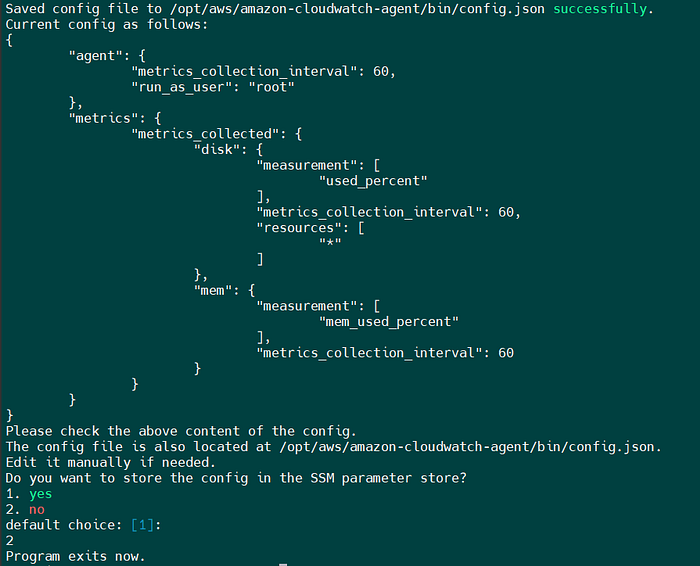
Provide some declarations for config files.

We can check json file under /opt/aws/amazon-cloudwatch-agent/bin/config.json
Now check the status of CW agent.
/opt/aws/amazon-cloudwatch-agent/bin/amazon-cloudwatch-agent-ctl -m ec2 -a status

Status is stopped now, so start it & check status after that.
/opt/aws/amazon-cloudwatch-agent/bin/amazon-cloudwatch-agent-ctl -a fetch-config -m ec2 -s -c file:/opt/aws/amazon-cloudwatch-agent/bin/config.json

Step 5: Check Custom Metrics in AWS CloudWatch:
Custom Metrics:
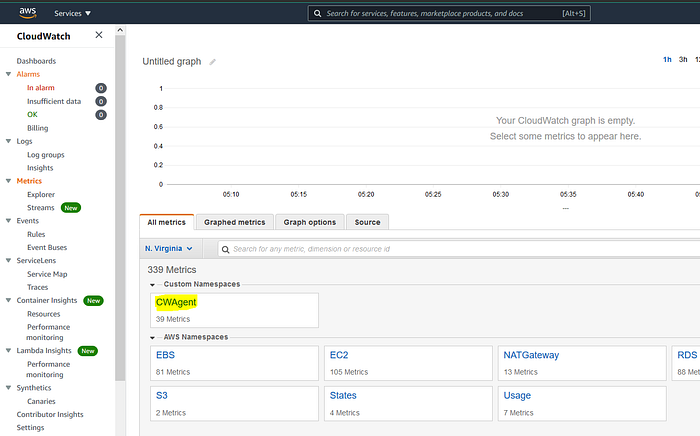
Check inside host for memory metrics:

Select the host according to private IP of instance & here you go with memory metrics of instance.

Step 6: Installation of Grafana
Now next step is to install grafana on EC2 Instance & integrate with CW custom metrics.
Install the MySQL database service
apt-get update && apt-get install mysql-server

Access the MySQL command-line & run below commands for DB creation & grant permission
mysql -u root -p
CREATE DATABASE grafana CHARACTER SET UTF8 COLLATE UTF8_BIN;
CREATE USER ‘grafana’@’%’ IDENTIFIED BY ‘your-password’;
GRANT ALL PRIVILEGES ON grafana.* TO ‘grafana’@’%’;
quit;

Use the following commands to configure the Grafana APT repository.
mkdir /downloads/grafana -p
cd /downloads/grafana
wget https://packages.grafana.com/gpg.key
apt-key add gpg.key
add-apt-repository ‘deb [arch=amd64,i386] https://packages.grafana.com/oss/deb stable main’
apt-get update && apt-get install grafana

Edit the Grafana configuration file grafana.ini.
vi /etc/grafana/grafana.ini
Perform the following configuration under the [Database] and [Session] sections.
[database]
type = mysql
host = 127.0.0.1:3306
name = grafana
user = grafana
password = your-password[session]
provider = mysql
provider_config = `grafana:your-password@tcp(127.0.0.1:3306)/grafana`

Use the following command to start the Grafana service.
service grafana-server start

Make sure we add port 3000 in instance security group to access the grafana.

Login:
Open your browser and enter the IP address of your server & port 3000.

Default Username & password is: admin/admin. At first login, we need to change password.
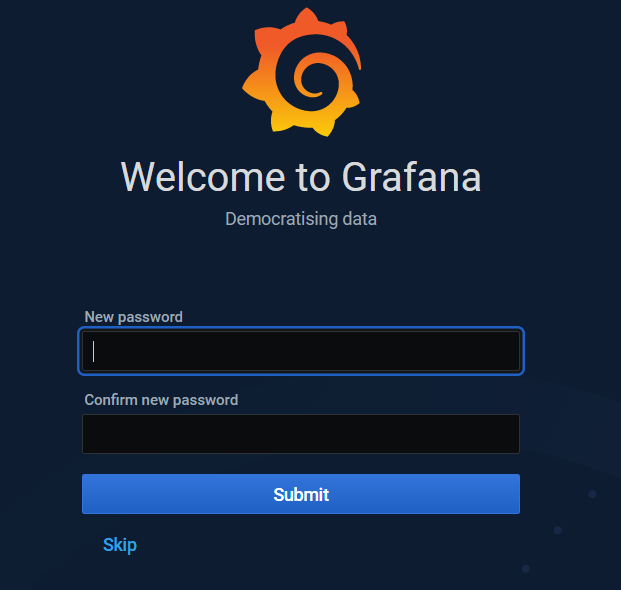
Step 7: Now add data source, Settings — Configuration — Data sources

Add Data source
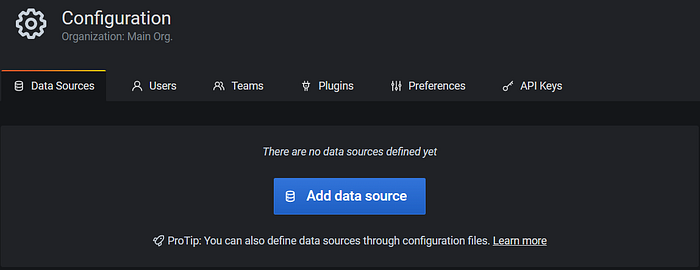
Search CloudWatch Data source & add it.

Now create an IAM user having onepolicy of read access & import in Grafana to provide access.

Now import below details in grafana.
1- Access Key ID 2- Secret Access Key 3- Default Region 4- Namespace of Custom Metrics(in my case, it’s CWAgent)
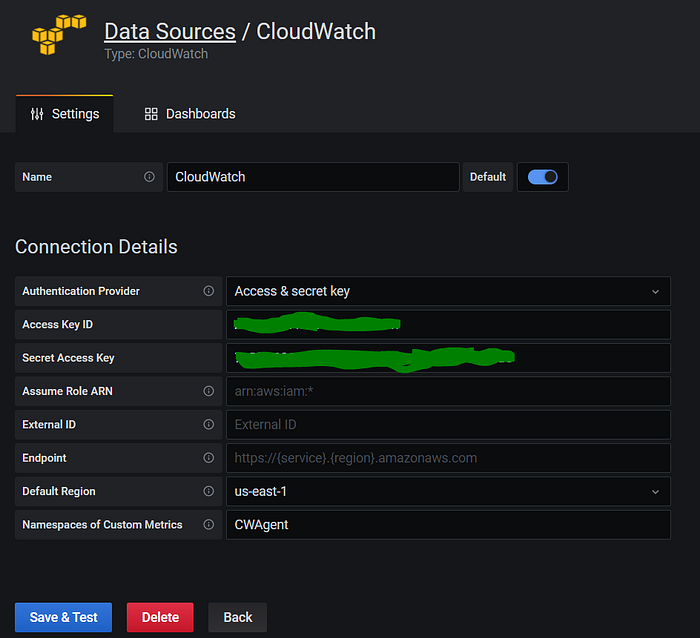

Now save & test, it will display below output.

Now create a dashboard, click on + icon & add an empty panel.

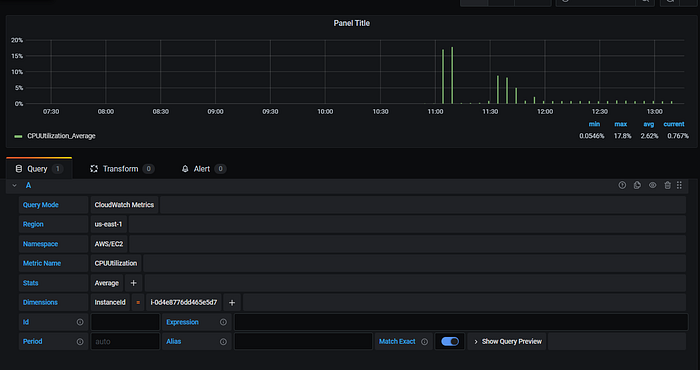
Now fill below details of query.
1- Query Mode — CloudWatch Metrics
2- Region — Where your metrics are (my case: us-east-1)
3- Namespace — custom namespace (in my case: CWAgent)
4- Metric Name: mem_used_percent
5- Stats: Average
6- Dimensions: select according to your metrics from CW Metric console (like below)


Once you provide all details, you will be able to see some data in graph.

OR

Save Dashboard.

For CPU Utilization from pre-built metrics:
That’s all for this blog.
